
Why use our services
Why use our services?
Usually, within different kind of studies, the sample, collected from the field (or plant or etc.), and the analytical sample, suitable for the further analyses (chemical, mineralogical, isotope and etc.) critically, up to several decimal orders, differ in volume. Obviously, such studies require some preliminary sample treatment, which allow reducing the sample volume until the analytical size, without losing the representativeness of the initial sample.
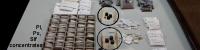
 Figure PS1. Representative sample.
|
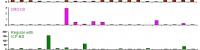
 Figure PS2. Chemical results.
|
The preliminary sample treatment is not so simple thing as it looks like. There are two main issues exist: the problem of losing the sample representativeness during treatment and the problem of low efficiency of the work. Let us explain these issues on common examples from our experience.
One casual example of unrepresentative sample processing during till prospecting is shown on the image on the left. It had been set up that the main interest of the sampling was to find the gold grains, which occur in the till sample as few ~60µm size liberated grains. Since there was no interest in gold concentration lower than 0.05ppm, the lowest work sensitivity was set up as 0.05ppm (the work sensitivity is not the same as chemical analyses sensitivity). According to the formula of phase equivalent of the element concentration (see technology of “ppm- mineralogy”), the representative sample weight is 430g. Obviously, first sample treatment step would be to sieve the sample in order to get analytical size fraction (-71µm). Average -71µm size fraction output in till of the area where the sample was collected, was around 10%, which gives the analytical sample weight about 43g. Conventional chemical analyses usually deal with 5g analytical sample, what means that the analytical sample has to be divided into 10 subsamples. Usually, only one subsample is being sent to chemical laboratory and analyzed. The result of such analyses is shown on the right image. If only one subsample from ten would be analyzed, then the result data will not be true and would not reflect the real gold concentration of whole sample. Those subsamples, which would contain gold grains, will give elevated concentration and those, where no gold grains, will provide zero result. Mapping of such wrong data on the map will provide artificial anomalies, which does not reflect the real ore component distribution.
Second issue flows from the first one. If all samples, collected from some area, were analyzed the way, discussed above, then how anyone can trust the results? One of the examples of using of such unreliable data is show on image of exploration map (see below).
Green circles show the analytical data after geochemical exploration (data from loose sediments). The red ones show the data from bed rocks where mineralization was found (economical or no economical). Obviously, there is no clear correlation between the green and red circles. According to our experience, only 10-15% of the analytical data show information closes to the native one, which does exist on the sampling area (i.e. Identity Factor = 10-15%, see “Why use our technologies”). It means that only 10% of investments bring back the results, which could provide benefits, but nobody can say which samples belong to these 10% and which not.
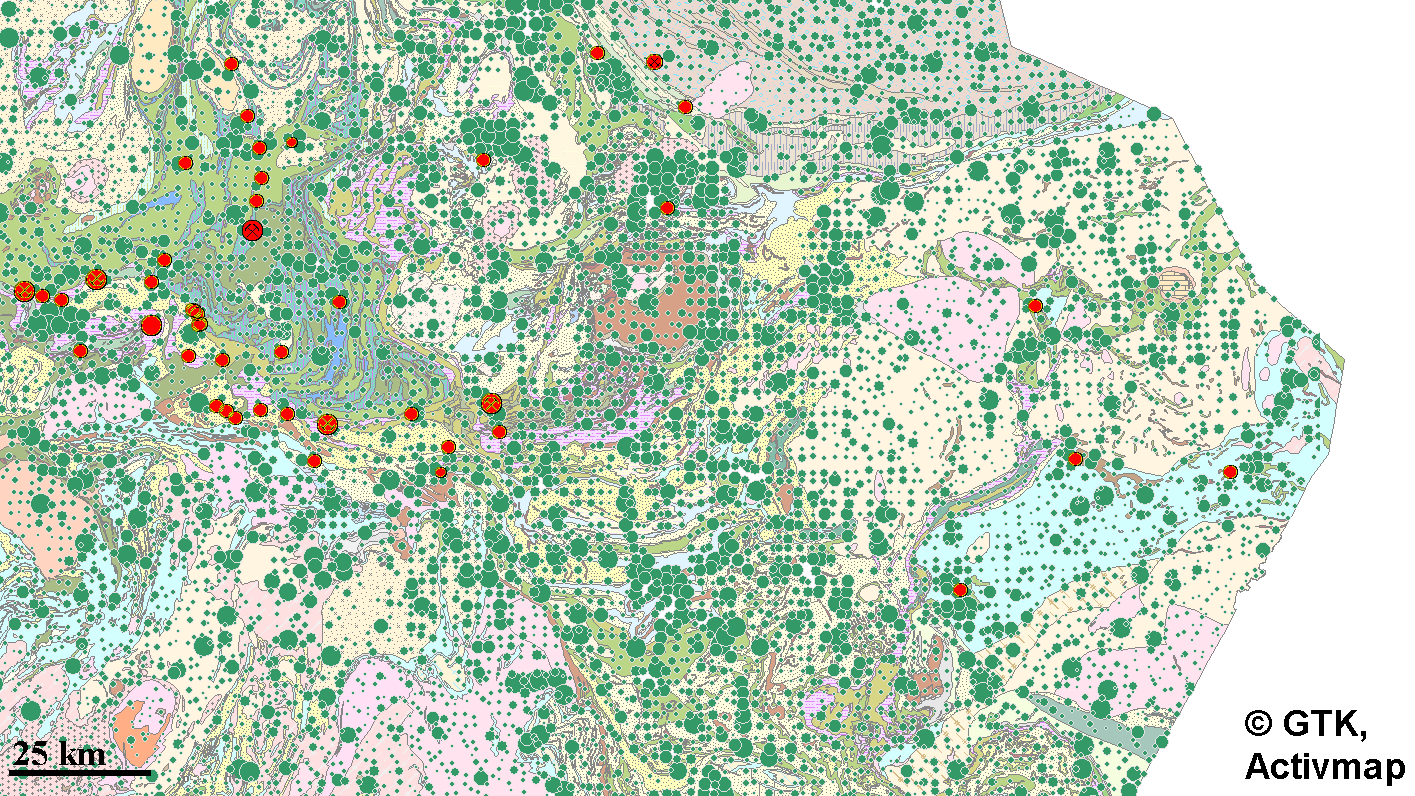 Figure PS3. Exploration map.
|
Our Company has found solutions for both issues by developing with followed by extensive successful testing of three advanced technologies – technology of “ppm-mineralogy” (©NATI Research), technology of automated mineralogy “ImSca” (©NATI Research) and CROCS Technology (©NATI Research). The technologies are supported by both our own developed advanced equipment and conventional equipment, as well as, by many years experience of our specialists. All our services are based on our unique technologies, equipment and experience and exclude the work with unrepresentative samples and allow the customer to obtain the reliable and economically beneficial results in limited time frames.