What do we inhale in Saint Petersburg?
Introduction
Here is one curios question: what do we inhale in Saint Petersburg? Obviously, it is air polluted with dust. But what dust? What are its contents?
Of course, the question is not new, and even has some answers already. Simply because such answers are of particular interest for citizens, environmental and ecology organizations and local authorities.
However, we dare to suppose that air dust is controlled systematically only for such generalized parameters as overall mass of dust in the air samples and elementary chemical composition of dust. Our assumption is based on the fact that dust is tiny particles (smaller than 500-100µm), and based on our geological experience, investigation of such small fractions is a non-trivial task.
Having in possession the necessary technologies and tools (see the "ppm-mineralogy" section on our website), we successfully apply them in geology to study earth materials and ores (see published articles). However, led by curiosity we decided to investigate phase composition of dust in typical urban air. Indeed, we do not inhale atoms of certain chemical elements, nor do we breathe acceptable concentrations (after all, concentrations are a non-substantial notion). Instead, we inhale small solid dust particles. So, what particles does dust contain?
When it comes to composition and measurement, we needed to find a way to collect samples for further analysis. So we came up with a simple idea of sampling. We collected samples on the roof of a typical apartment building: after rain, air dust accumulated in small pools of water on the roof. After the pools dried out, a thin layer of residues was left in the hollows of the roof surface. Then, we wetted the residues of the pools with main water and collected the resulting slush using a clean sponge. We squeezed the sponge to the bucket then and collected material for analysis. We studied only the "heavy" component of the residues, while the vegetative detritus, "light" and water-soluble components were not analyzed. (See the technology in the "ppm-mineralogy" section).
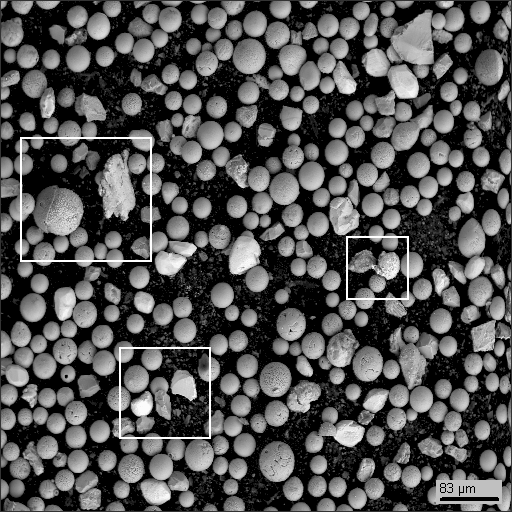
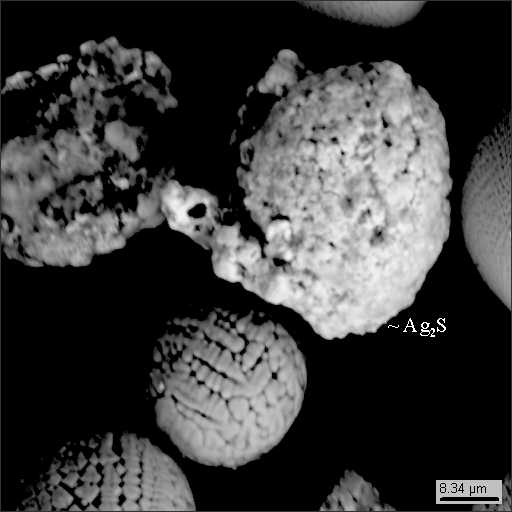
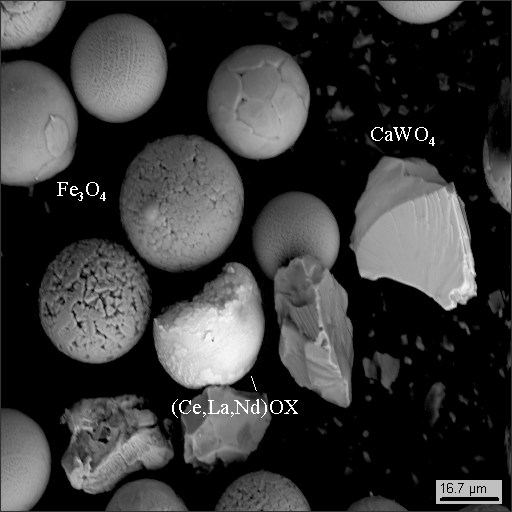
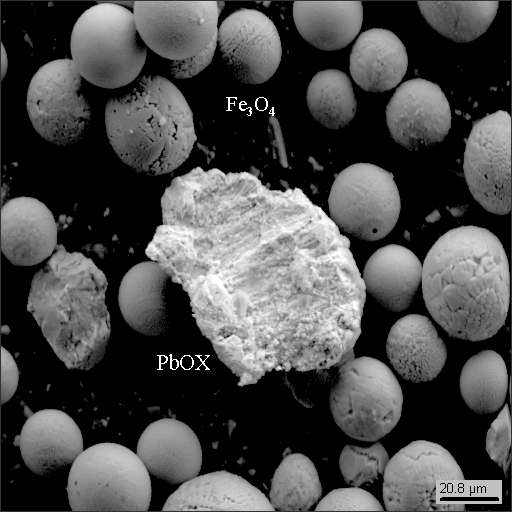
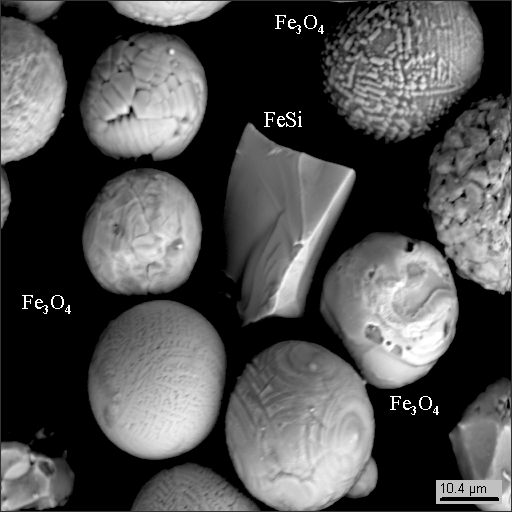
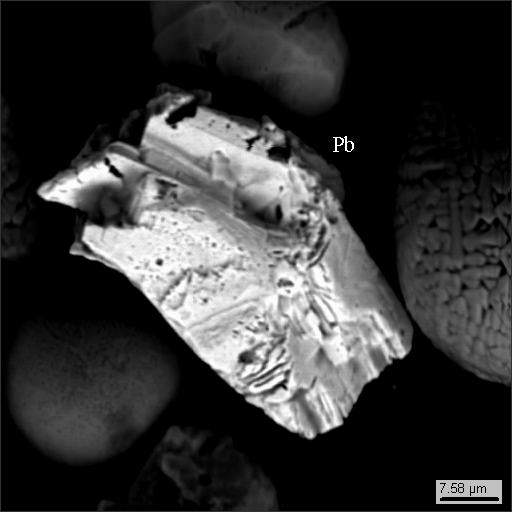
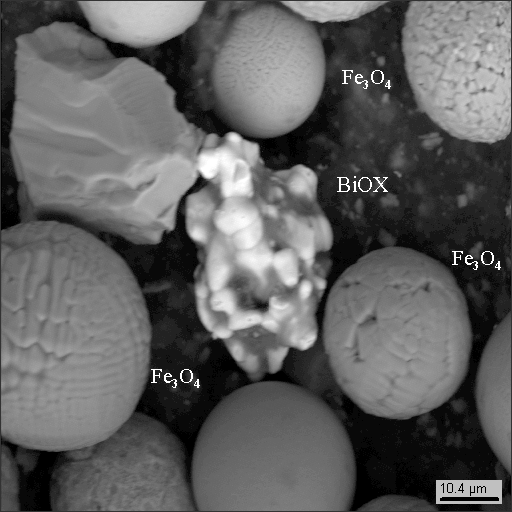
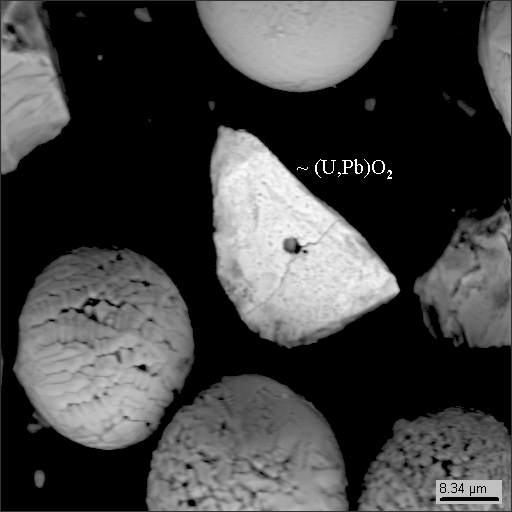
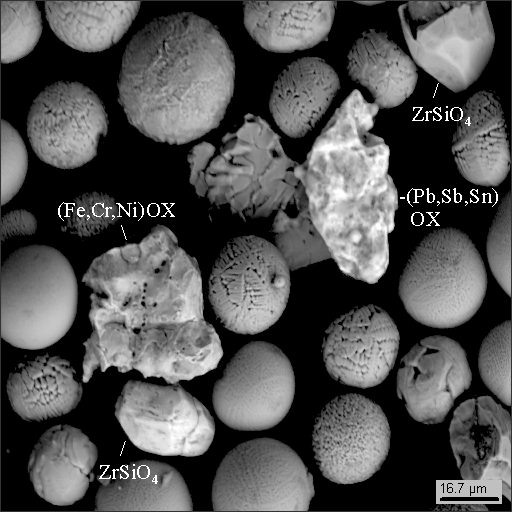
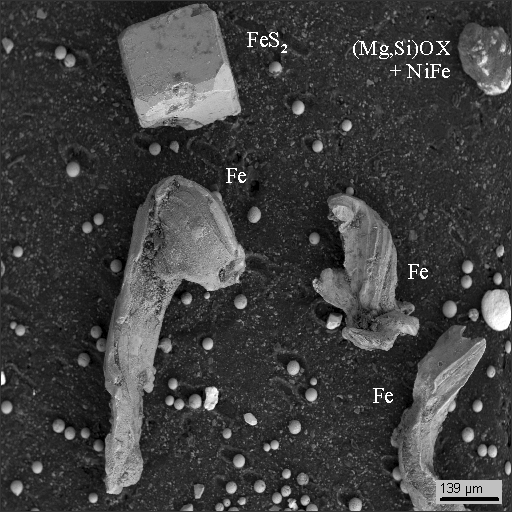
Below are the data for heavy concentrations of the sample, obtained on the electron microscope Hitachi S570 equipped with the SDD detector that allows distinguishing micrograins of dust by their elementary composition (using X-Ray spectral analysis including oxygen detection).
Dust particle photographs
 1
|
 1-1
|
 1-2
|
 1-4
|
 2
|
 2-1
|
 2-2
|
 2-3
|
 2-4
|
 3
|
 4
|
 6
|
 7
|
 8
|
 9
|
 10
|
 11
|
 12
|
 12-1
|
 12-2
|
Remarks: OX - metal oxides
|
Interestingly, photos 9 and 10 are nothing else but stony-iron meteorites: Ni3(Fe,Co) awaruite (Aw) in serpentinite (Srp) with magnetite (Mgt).
The polished grain encapsulated in organic compound (photo 13), and the distribution map of elements (photo 14) are shown below.
 13
|
 14
|
|
Elementary composition of minerals in the meteorite is listed in the table below
|
 |
|
Note: the first line in the table is mass percent, the second one is formula fractions of chemical elements
|
The more you have, the more you want, so it’s no wonder our curiosity wasn’t satisfied after we analyzed just one roof. The photo 15-1 displays a typical window with window blinds on it in an apartment on the 9th floor.
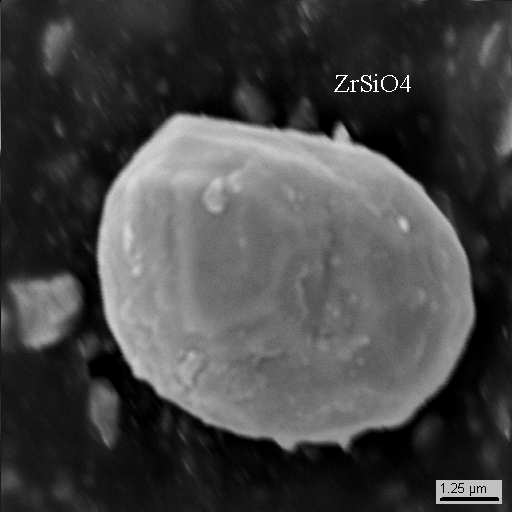
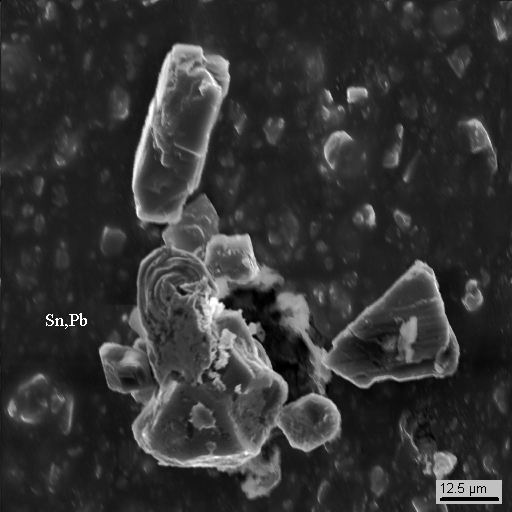
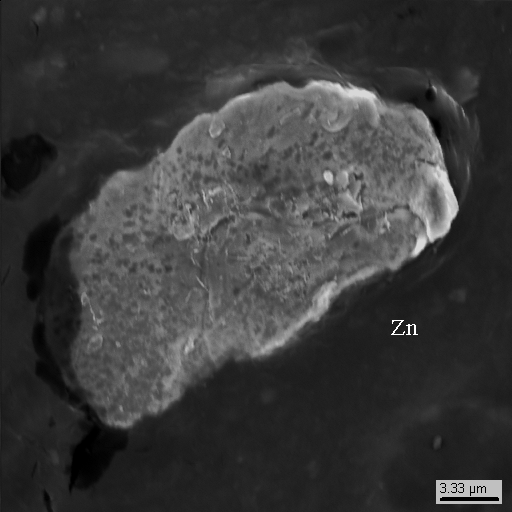
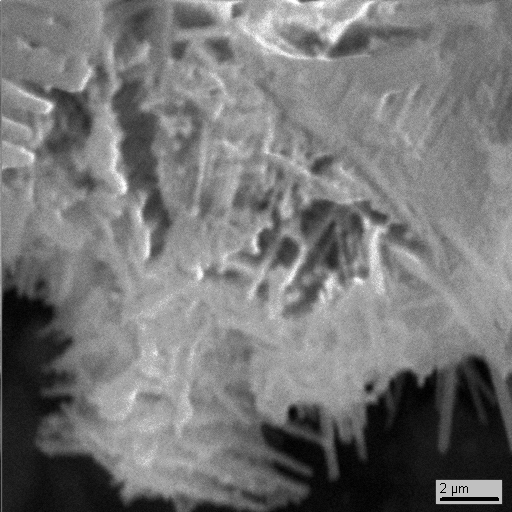
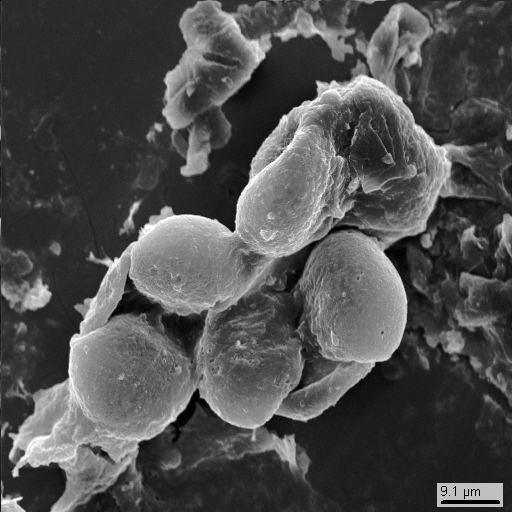
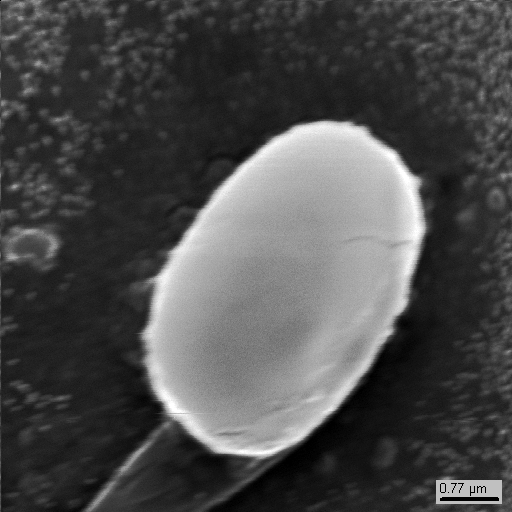
A small ventilation pane in the window is often opened which results in plenty of dust gathered on window blinds. We collected samples of dust using a wet sponge near the ventilation pane. Then, we examined dust contents with the electron microscope (photos 15-2 - 15-26).
 15-2
|
 15-3
|
 15-4
|
 15-5
|
 15-6
|
 15-7
|
 15-8
|
 15-9
|
 15-10
|
 15-11
|
 15-12
|
 15-13
|
 15-14
|
 15-15
|
 15-16
|
 15-17
|
 15-18
|
 15-19
|
 15-20
|
 15-21
|
 15-22
|
 15-23
|
 15-24
|
 15-25
|
 15-26
|
|
|
What’s interesting is that along with particles of earth minerals (pyroxene, magnetite, zircon and others, see photo 15-2 - 15-4) and technogenic phases of lead, tin, copper, zinc etc. there are neogenic idiomorphic microcrystals of zinc (photo 15-10, 15-15) of unknown genesis that closely associate with tin and lead.
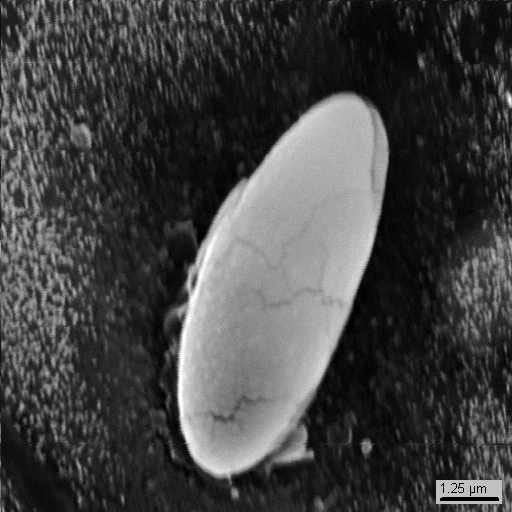
Aside from mineral phases, the dust also contains bioorganic particles (photos 15-15 - 15-26). These could be spores or pollen, or eggs of some insects, but they could also be some byproducts of small fauna. If you are versed in biology more than we are, please let us know what the particles shown on photos 15-22 - 15-26 are: they are way too small...
 |
Furthermore, the rooftop of the building and window blinds only piqued our interest. So, armed with a plant sprayer and a squeegee (on the photo) we went outside to the street.
Surely, even in the middle of rainy fall windows still gather dust. We wetted window-glass using the plant sprayer and scraped the wetted dust using the squeegee. This simple method produced enough solid particles to analyze dust contents using the electron microscope after the material was concentrated.
Overall, we collected about 300 mg of solid dust particles from one 2 sq.m. window on the first floor of a house located far enough from highways and roads. The sample was further studied.
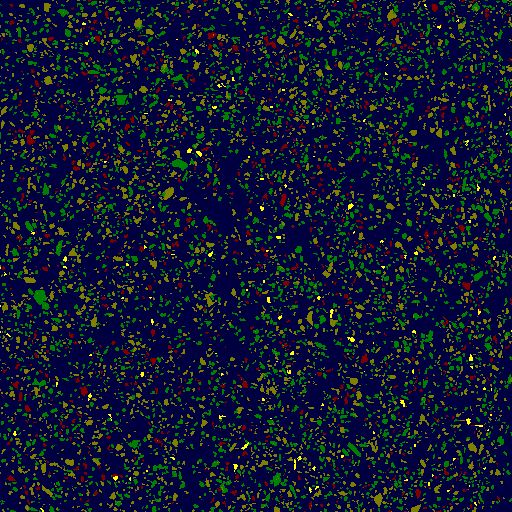
Unlike previous objects, we didn’t perform concentrating with large concentration factors, because the total number of grains in the retentate was big enough, and that in turn required applying some study methods that were not necessary before. Photos 16-1 and 16-2 display backscattered electron images of one of eight fields of view of our electron microscope inspecting the specimen containing 6321 dust particles. Since we were interested mostly in “heavy” phases (that is, phases with higher density values), the received image was processed on the computer using the original software ImSca24 that allows grouping particles by density and assigning certain colors to various density ranges. Then, the software consequentially positions the electron probe to each particle of the specified color range and determines mineral composition of each one by X-Ray spectrum. Besides, it also computes area of each particle and investigates volumetric ratios between all particles of the specimen. (As a side note: further processing of data allows to determine masses of each element in particles and in the sample altogether to receive concentrations of elements with a method that’s independent (!!) of other traditional methods of chemical analysis). In our case the heaviest particles are yellow (122 particles). Other three density groups of particles (741, 2473 and 2985 particles) were not studied despite stringent systematic study would require that.
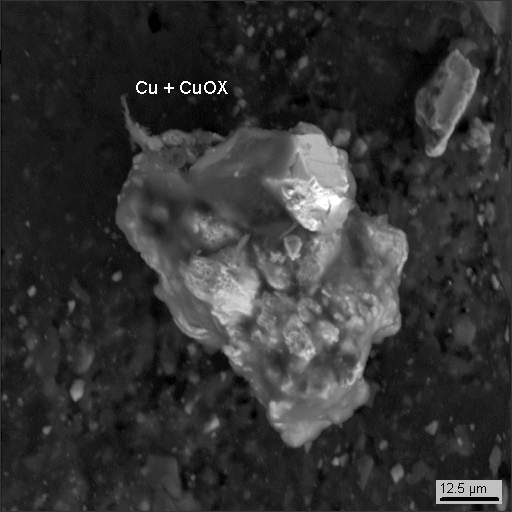
Photographs in the SE mode of some dust particles (“heavy” or not) are shown on photos 16-3 - 16-14.
 16-1. 512х512 pixels. 1px = 2,3µm
|
 16-2
|
 16-3
|
 16-4
|
 16-5
|
 16-6
|
 16-7
|
 16-8
|
 16-9
|
 16-10
|
 16-11
|
 16-12
|
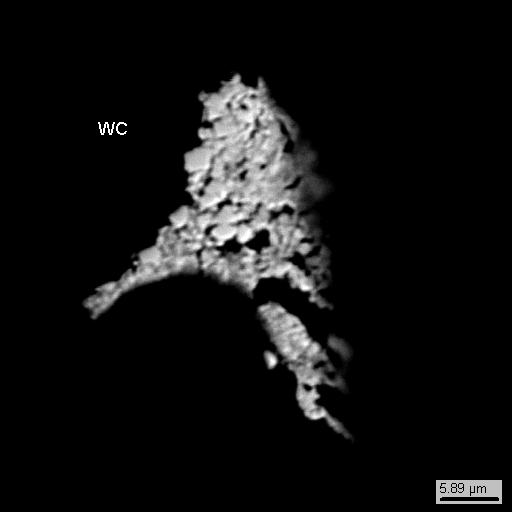 16-13. Tungsten carbide
|
 16-14
|
|
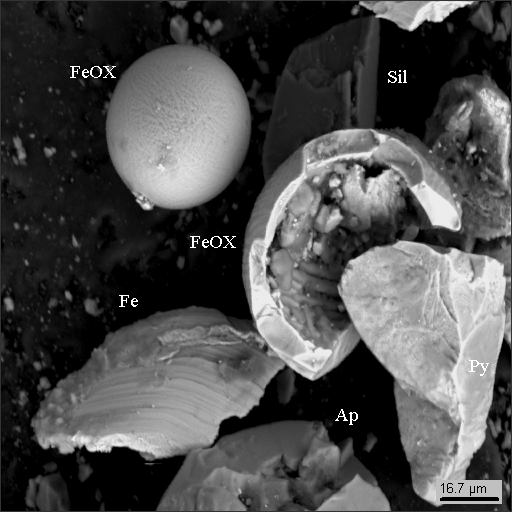
The window-glasses basically contained the same “heavy” technogenic(man-caused) phases as those gathered on the roof and window blinds. Lead, tin, copper, iron and stainless steel.
We found some colloform gold, which was unusual to us. But then as we discovered later, gold traces on window-glasses is typical (two windows out of two examined had it).
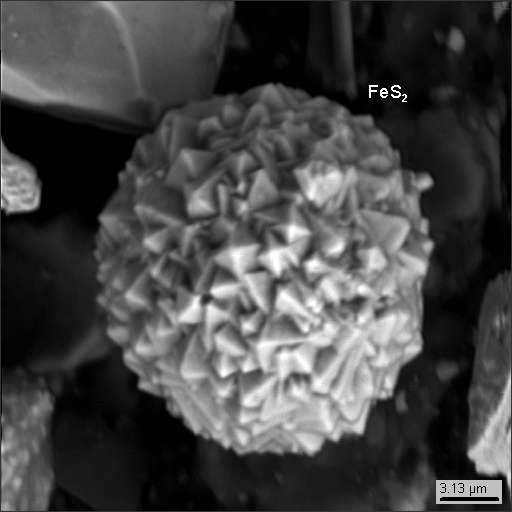
Groups of average density are mostly represented by fractured grains of accessory minerals such as titan and iron oxides, phosphates, REE oxides (Ce, La, Nd), zircon and iron disulphide, probably newly formed, not terrigenous (photo 16-3,4).
And while we are outside in winter, we took the opportunity to take samples of snow piles lying on the street. Is there dust in winter? One would say no, but we’ve got to check. We took a small bucket (5 liters), and packed snow gathered near the Porokhovye district in Saint Petersburg into it. The sample was taken 50-80 m away from the Kommuna street with intensive traffic. After the snow melted, we poured the water out and carefully gathered solid particles from the bottom of the bucket. Then, we prepared specimens for the electron microscope the same way as we did before.
 17-1
|
 17-2
|
 17-3
|
 17-4
|
 17-5
|
 17-6
|
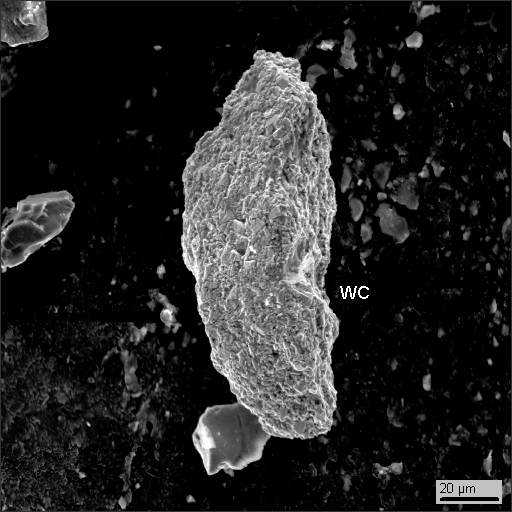
Like it was in all previous measurements, among particles collected from the snow we revealed fractured grains of rock-forming and accessory minerals and man-caused phases of lead, tin, copper, iron and their oxides. We also discovered a significant quantity of tungsten carbide (WC). Explanation is simple: winter tires (photo 17-6) have steel studs protruded from the tire to deliver better traction on ice. These studs have a core (the upper part of the stud on the photo) made of tungsten carbide.
While particles of WC near the road (50-80 m) in winter is no surprise, the same tungsten carbide (see photo 16-3) found on window-glasses of a house located in a quiet block far from any road traffic in autumn when cars “wear” non-spiked tires is far more interesting! The way things are going now, we will mine tungsten and lead along the roads and on the windows rather than in mines.
As we finished examining dust at home, on the street, on window-glasses, on the roof and near the road, we decided to make a longer trip for new data. We chose a clean Finnish miner town of Outokumpu. In the past, there were nickel and copper mines nearby, but for many years these mines are closed. I had seen old miner villages in Karelia: ruins of walls and buildings, a rusty skeleton of a pile driver, bricks with crumpled armature, plastic bottles and broken glass all over. Trash hole. Nothing like that in Suomi (see the photo). Well done! That’s an example of respectful attitude to history and predecessors.
 Museum, processing plant. In the distance – mine pile driver.
|
 Museum, contemporary mining equipment
|
At first glance, there is no dust in the town, but still we decided to check. We used the same proven method of collecting dust from window-glasses that we used in autumn.

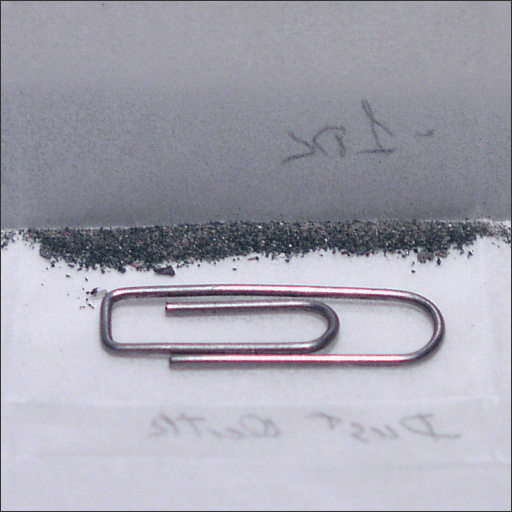
The samples contained a lot of everything. Retrospectively, it was our mistake to sponge the balcony rails: it seems we involuntary collected a lot of paint flakes that have little to do with dust.
 18-1
|
 18-2
|
As we did previously, we separated granulometric fractions, then concentrated them using relatively small concentration factors, and prepared specimens for the electron microscope from retentates to identify each phase by its elementary composition using the SDD detector.
 18-3
|
 18-4
|
 18-5
|
 18-6
|
 18-7
|
 18-8
|
 18-9
|
 18-10
|
 18-11
|
 18-12
|
 18-13
|
 18-14
|
 18-15
|
 18-16
|
 18-17
|
 18-18
|
 18-19
|
 18-20
|
 18-21
|
 18-22
|
 18-23
|
 18-24
|
 18-25
|
 18-26
|
 18-27
|
 18-28
|
 18-29
|
 18-30
|
|
|
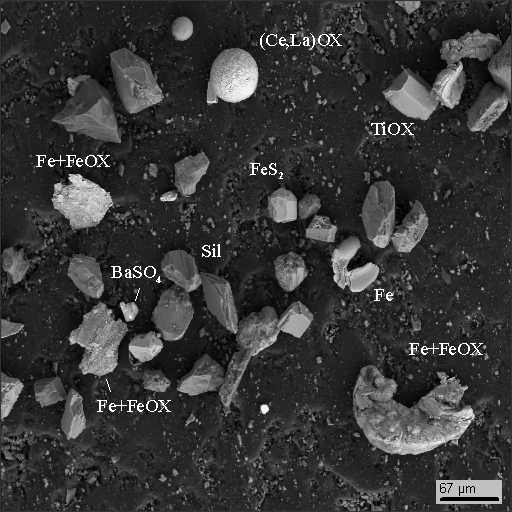
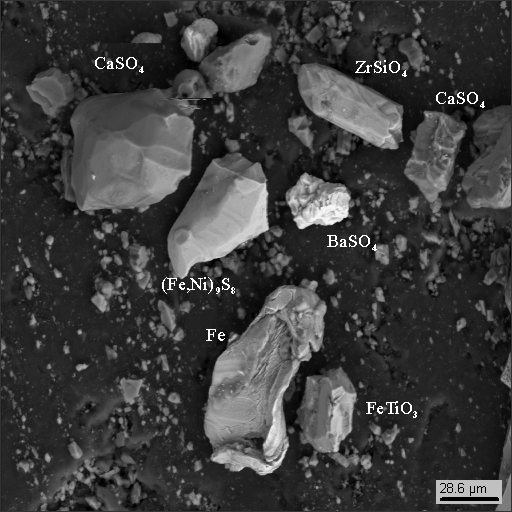
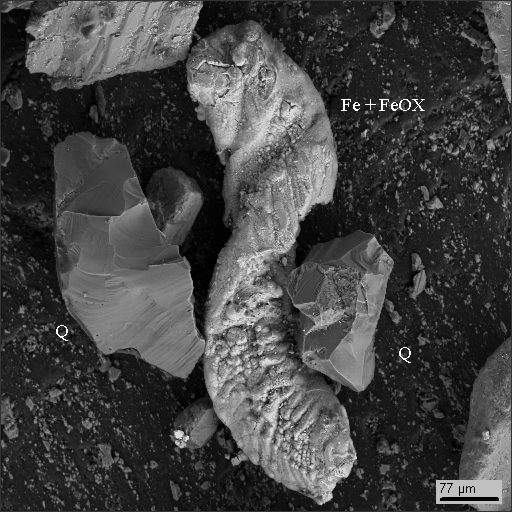
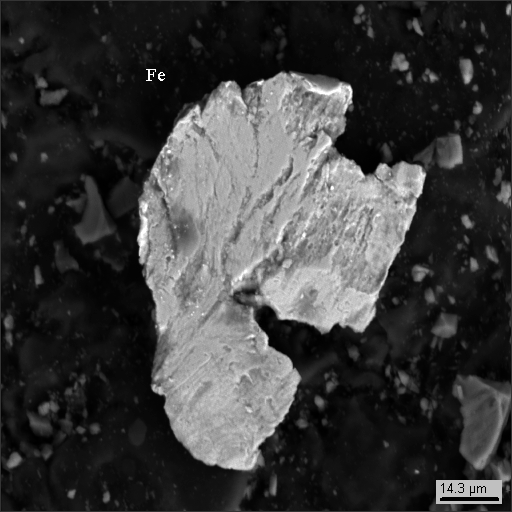
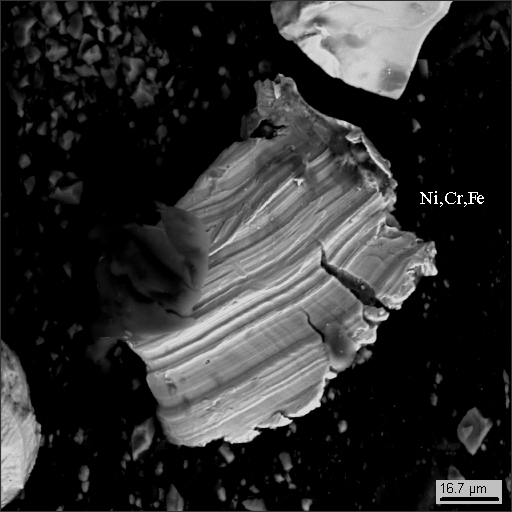
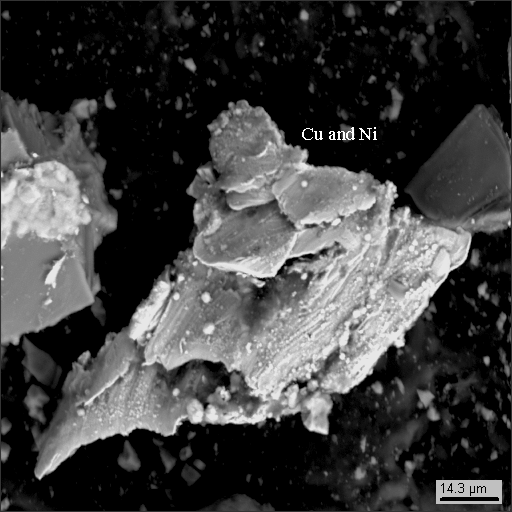
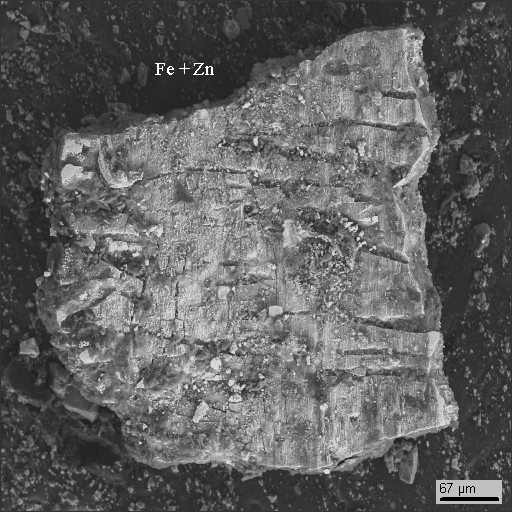
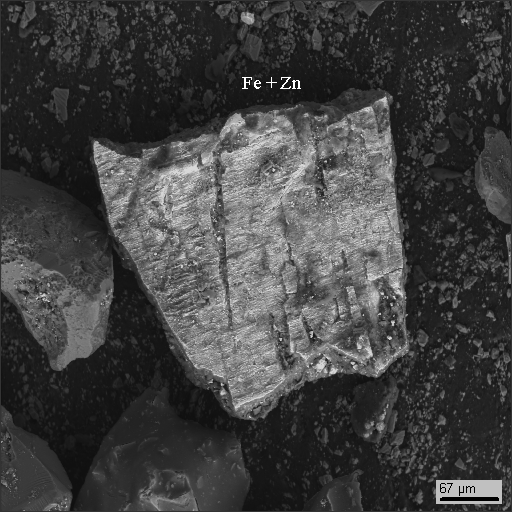
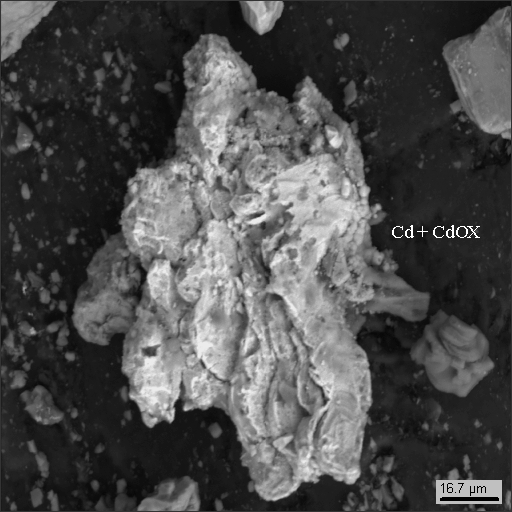
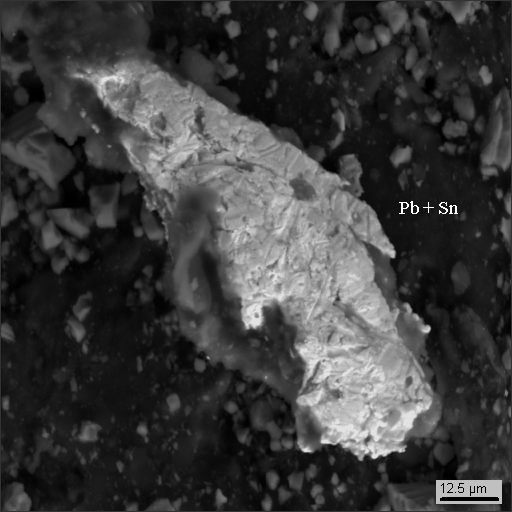
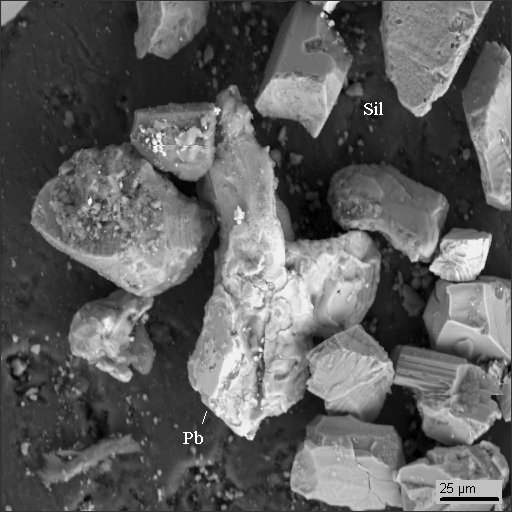
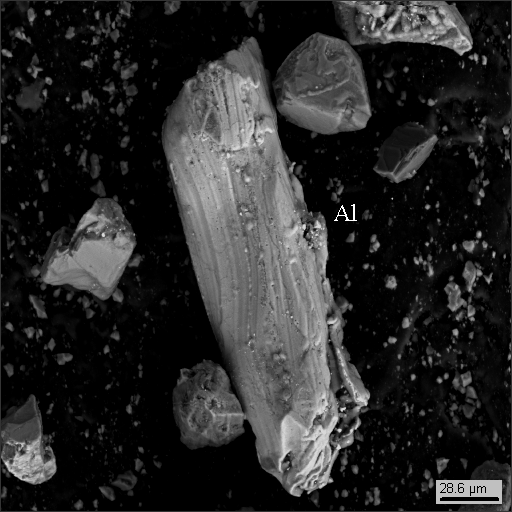
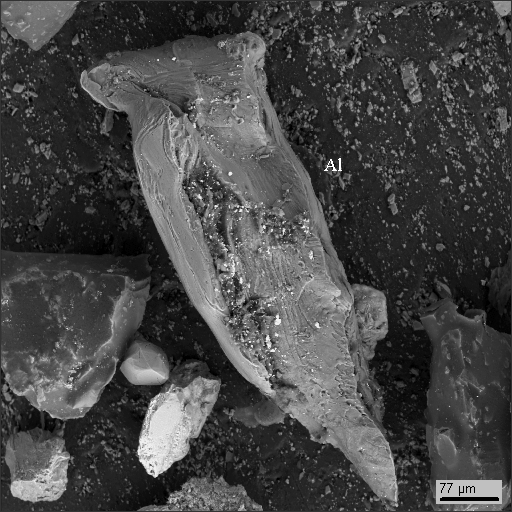
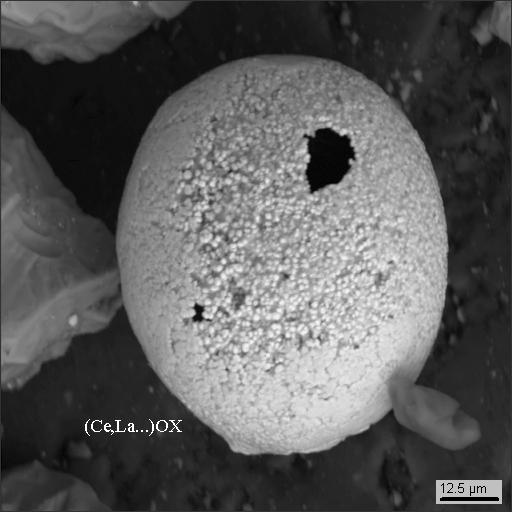
During examination, we revealed four main phase groups in “heavy” concentrates:
1. rock formations (iron-titanium oxide, sphene, magnetite, zircon, phosphates and oxides of rare-earth elements) and sulfates of the oxidized leach cap (baryte, gypsum),
2. copper-nickel minerals (sulfides and arsenides of iron and nickel: arsenides are peculiar to nickel ores of Outokumpu),
3. metallic man-caused phases and their oxides (iron, lead, tin, copper, zinc, scoria, stainless steel, aluminum, cadmium and cadmium oxide).
Aside from these three groups of “heavy” concentrates phases, there are “light” components in the sample
4. multiple glass-like phases that are greenish under the binocular microscope (see photo 18-2).
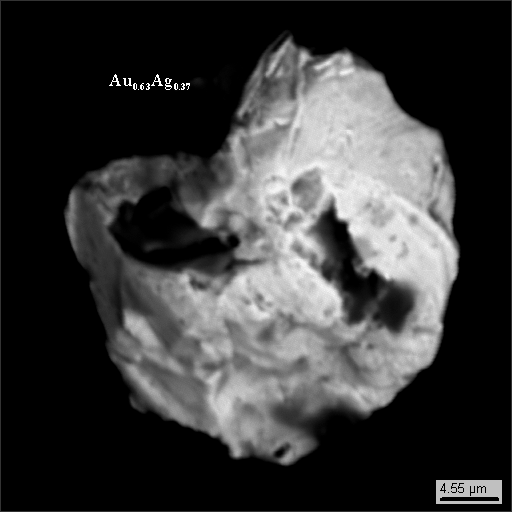
Similarly to samples taken on the window-glass in Saint Petersburg, samples from glasses in Outokumpu also have gold particles (photo 18-26).
 |
The fourth group of phases does not match all others. Its contents are “light” fractions and the form of grains is untypical to rock minerals or man-caused industrial “heavy” phases. These light phases make up a significant part of the entire sample.
To obtain more in-depth information about these phases we conducted some more research.
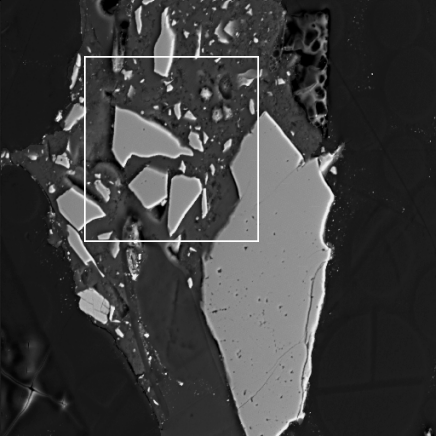
Individual grains we cemented using organic acrylic compound, then polished and finished to obtain a slice of grains for further examination of material composition using X-Ray spectral electron probe analysis.
The results are shown on the photographs below (18-31 - 18-36).
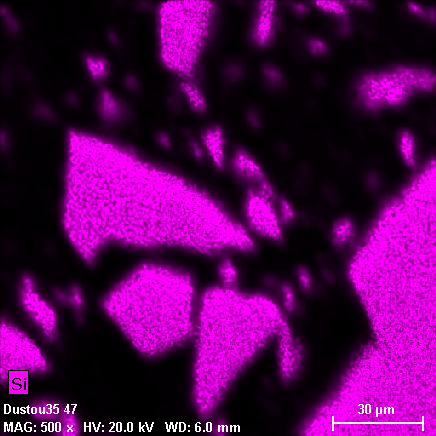
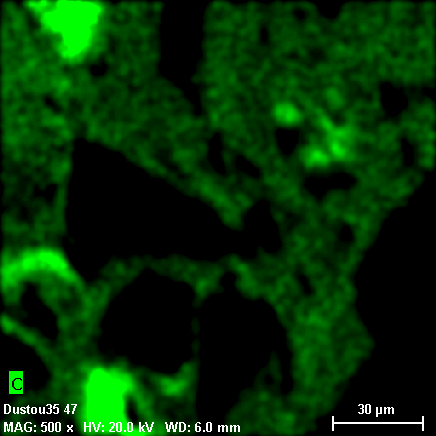
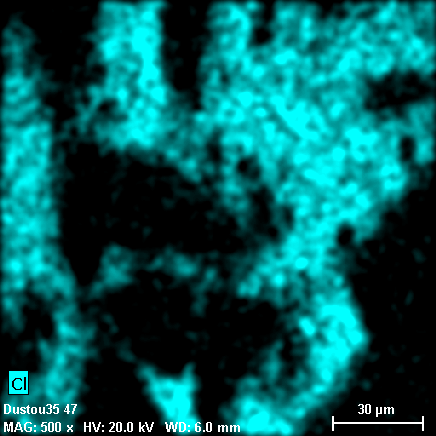
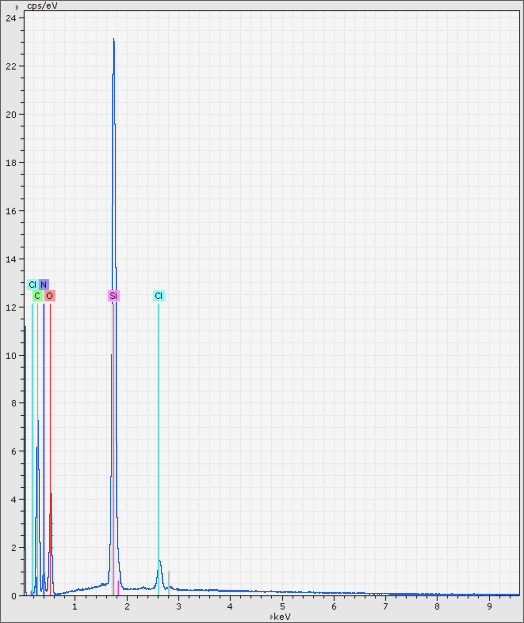
Grains in these phases are heterogeneous both in terms of phase and chemical composition. Individual fragments of silicon dioxide (light-gray particle on the photo 18-31, quartz may be?) are encapsulated to the organic matrix constituting carbon, nitrogen, chlorine, while oxygen is not found in any substantial amount. Hydrogen contents are also possible, because hydrogen cannot be detected with X-Ray spectral methods. Overall X-Ray spectrum of the area selected on the photo 18-31 is shown on the photos 18-37, 38.
 18-31
|
 18-32
|
 18-33
|
 18-34
|
 18-35
|
 18-36
|
 18-37
|
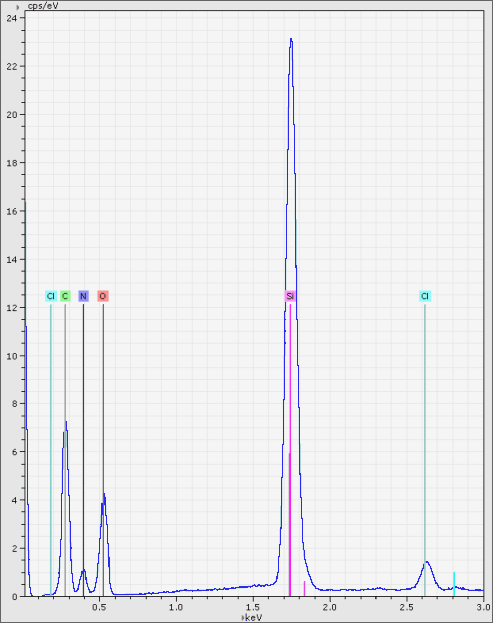 18-38
|
The nature of these phases is unclear. We can guess these are some kinds of glues or epoxy resins, or plastics used in construction or in chemical or woodwork industries. If anything, these are artificial products that come to the atmosphere from local sources: industries that use or produce these materials.
Concluding our walk across Outokumpu, we can’t help but noticing one fun fact. Even though the mines are closed years ago and mine dumps are recultivated (leveled and transformed to nice golf fields covered with wonderful green grass), dust contents still includes minerals peculiar to this particular deposits. This means dust is extremely sensitive and stable indicator of local conditions. Even though our research is fragmentary and incomplete, the same conclusion can be made regarding samples taken in Saint Petersburg. Bismuthal ceramics on the roof, tungsten carbide near the roads, crystals of zinc and lead on window blinds...
Conclusion
All revealed grains from various samples shown above are small and are easily taken by wind, so the answer to the headline question is obvious. What we see here is what we inhale and what our lungs have to filter.
Dust contains particles of minerals (pyrite, oxides and phosphates of REE, zircon, magnetite, iron-titanium oxide, uraninite, scheelite and others) as well as grains of man-caused phases and oxidation products (iron, stainless steel, lead, tin, nickel, tungsten, copper, zinc, antimony, silver, cadmium, aluminum, magnesium, silicon and their oxides). Gathered data are merely a quick peek to an extremely interesting problem that pretends to be neither fundamental, nor complete. However, further systematic study of the problem may lay the foundation for more substantial findings.
And the need to conduct such systematic studies is seen with a naked eye today:
1. Evaluating dust contamination of the air using threshold limit value (TLV) is non-informative. There is a difference between “virtual” TLV for lead n*10-m and a specific quantity of tiny particles of lead inhaled to lungs. You can’t inhale concentration. It’s non-material, a phantom. Merely a number that has no effect on the body. But if you inhale five particles of lead (or even worse five particles of (U,Th)O2 or cadmium) the consequences will be direct and measurable: mechanical, chemical, radiogenic. Only one mutated cell is required to eventually grow into a big cancerous tumor. Allergy and immune problems also grow from such micro impacts which are nevertheless material unlike phantom TLV. We may have below the TLV water, air and food, and everything seems alright yet still we have got more and more allergic people each year, more and more health problems, higher death rates and so on. The statistics is a clear evidence of the deceptive nature of TLV and overall concentration-based approach to safety. Measuring water and air health using concentrations is the ostrich modus operandi: you hide your head and don’t see dangers anymore, but the dangers are still here. Yes, there are less dust in the air of Outokumpu, but even there dust has a lot of harmful components. TLV is a proxy indicator...
2. Phase contents of dust are a sensible and stable indicator of local environmental conditions. This opens a prospect to systematic investigation of dust: collecting samples across the area of equal scale, splitting areas to regions, determining local origins and dispersion zones of specific phases. Possible applications of these data are numerous: environmental protection, health care, forensic science and more.
